Datafest 23'
Aug 27, 2023
Datafest is a data-focused hackathon organized by the American Statistical Society (ASA). In it, teams are given a dataset and a problem to solve. The teams have limited time (two days) to analyze the data and compile a presentation to be studied and judged.
This year, the dataset came from the American Bar Association’s organization for free legal answers, a program to provide free legal advice to people who cannot afford a lawyer. The dataset contains information about the users, the questions they asked, and the answers they received. The problem centered around better understanding their user-base and its needs, and coming up with ways to improve the platform’s effectiveness.
Our Analysis
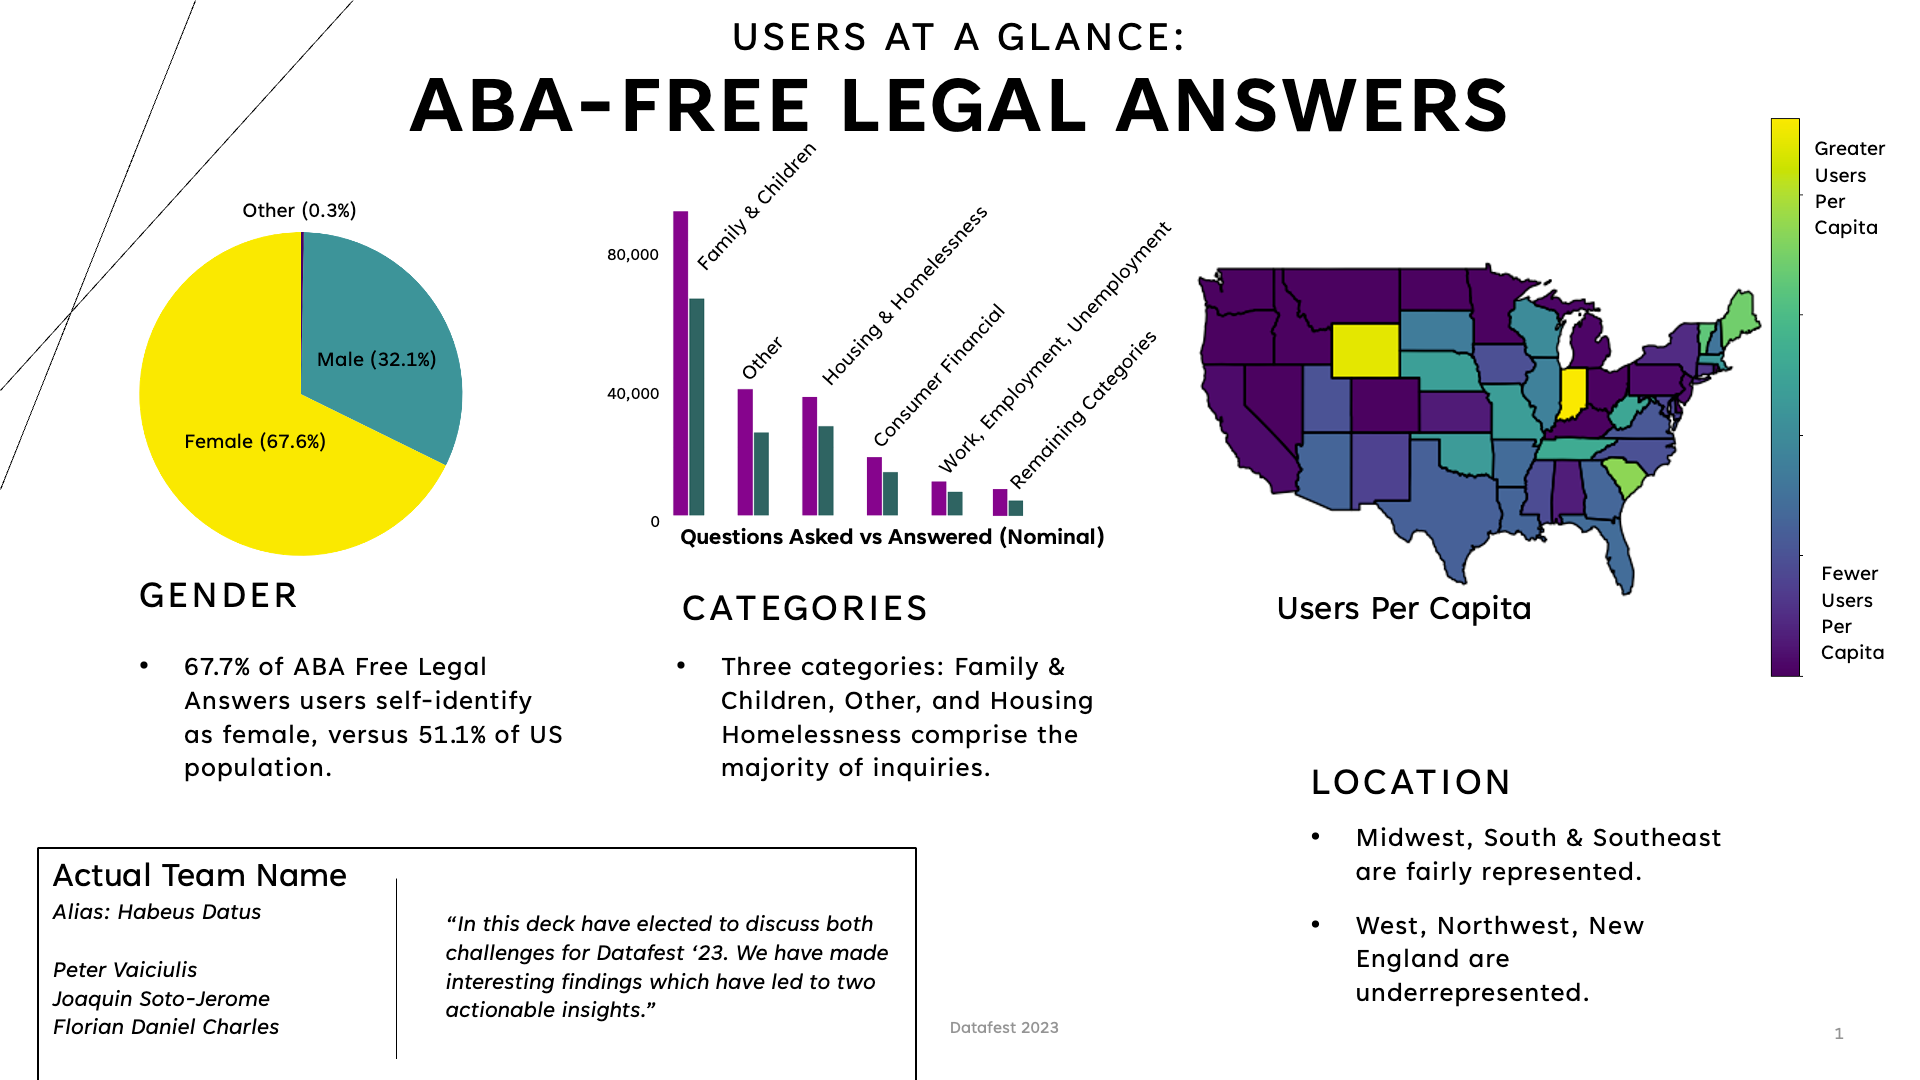
Introduction - User Demographics
In analyzing the user demographics, we came across a couple interesting findings, or data points we considered to be unexpected. The three categories were:
Gender
Question Categories
User Geography
Gender
Women are overrepresented, with over 2/3 of users self-identified as female, versus about 50% of the general population.
Categories
The most common category by quite a wide margin is family law, with over 1/3 of all questions being in this category. This might explain the high number of female users.
Geography
Studying the geographic distribution of users, we found that the most of New England, and the Pacific Northwest are underrepresented, while the South and Midwest are represented proportionally, and two outliers, Wyoming and Indiana were highly overrepresented.
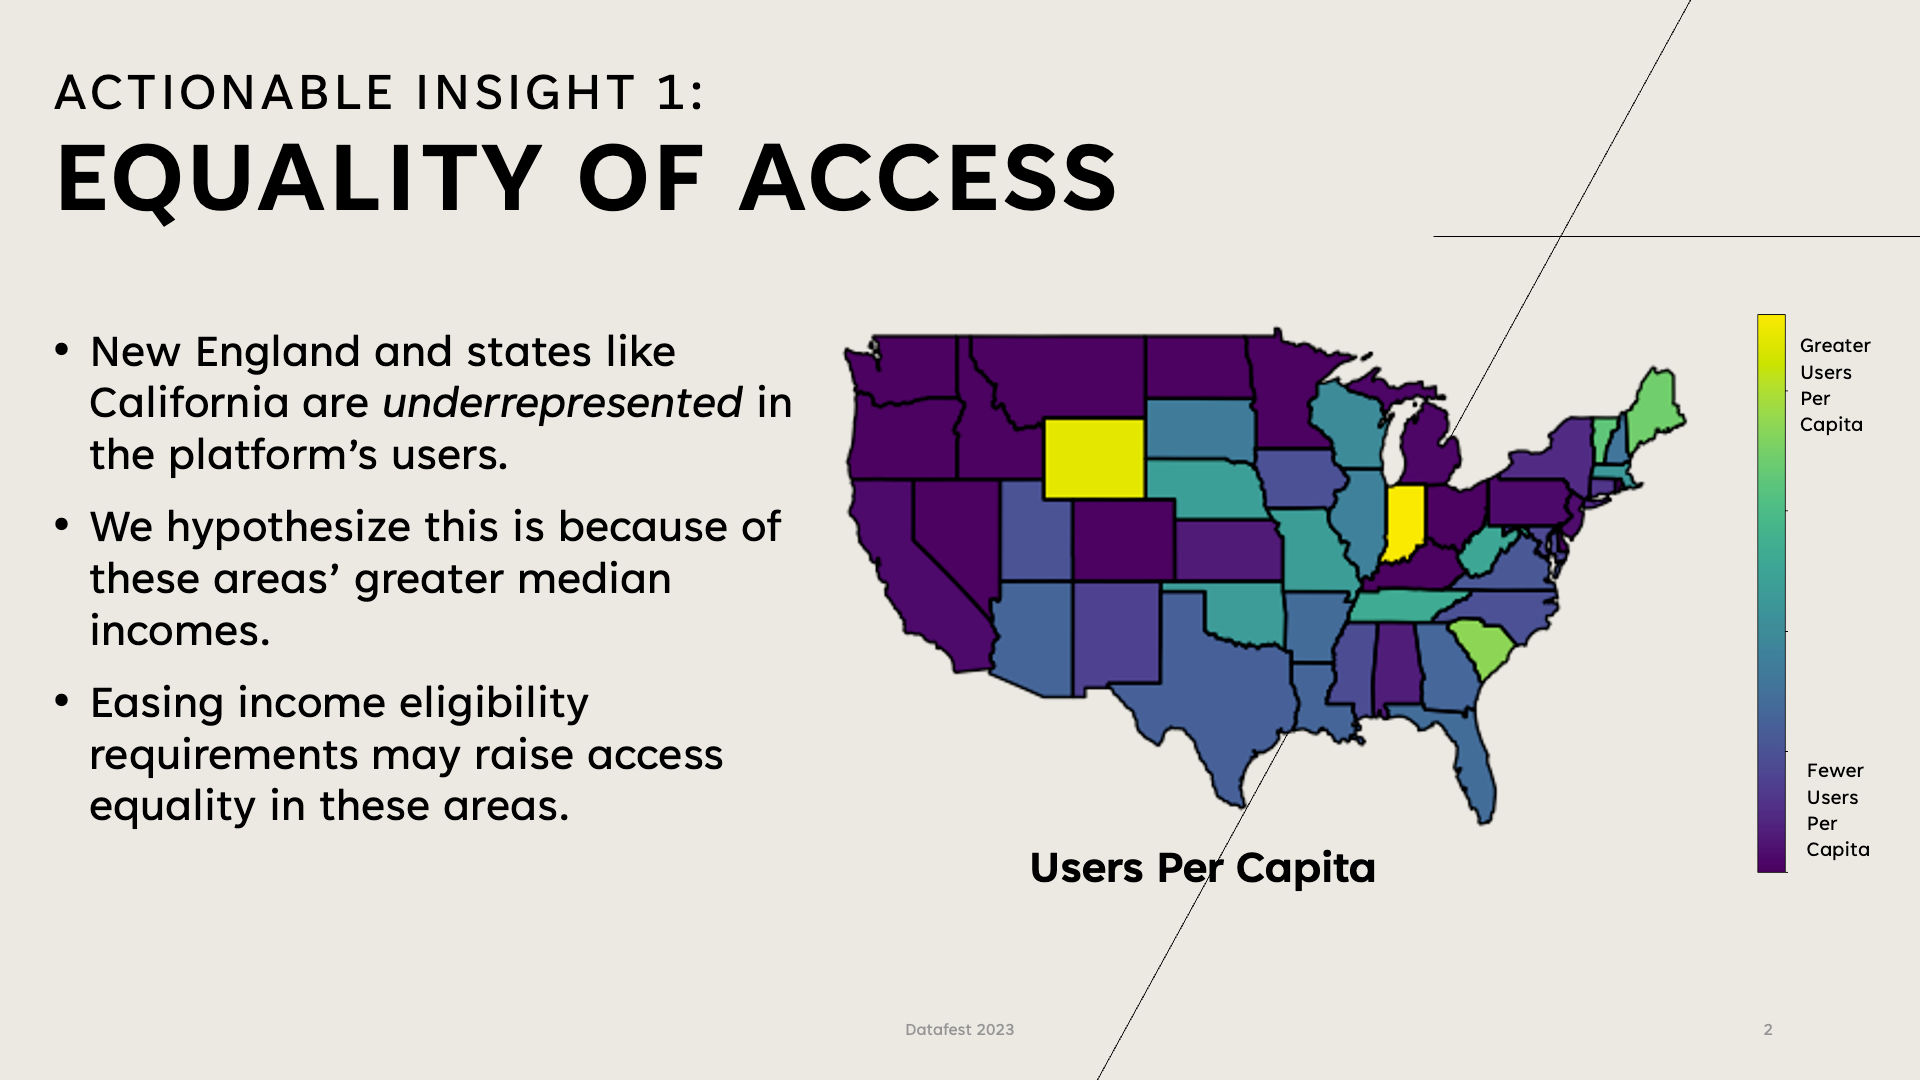
Equality of Access
In this section, we looked closer at the geographic distribution of our users, and found that there are some areas where access to legal advice is not equal. Our analysis concluded that one of the primary reasons for this disparity is the financial qualification rules for the program. The program is only available to people who make less than some amount of money, and the amount of money varies by state. In states like California and Washington, the income limit is disproportionately low compared to the median income in the state, while in states like Wyoming and Indiana, the income limit is disproportionately high compared to the median income in the state.
Therefore, to improve access to legal advice, we recommend that the program adjust its income limits to be more proportional to the median income in each state. This would allow the program to reach more people in states with higher median incomes.
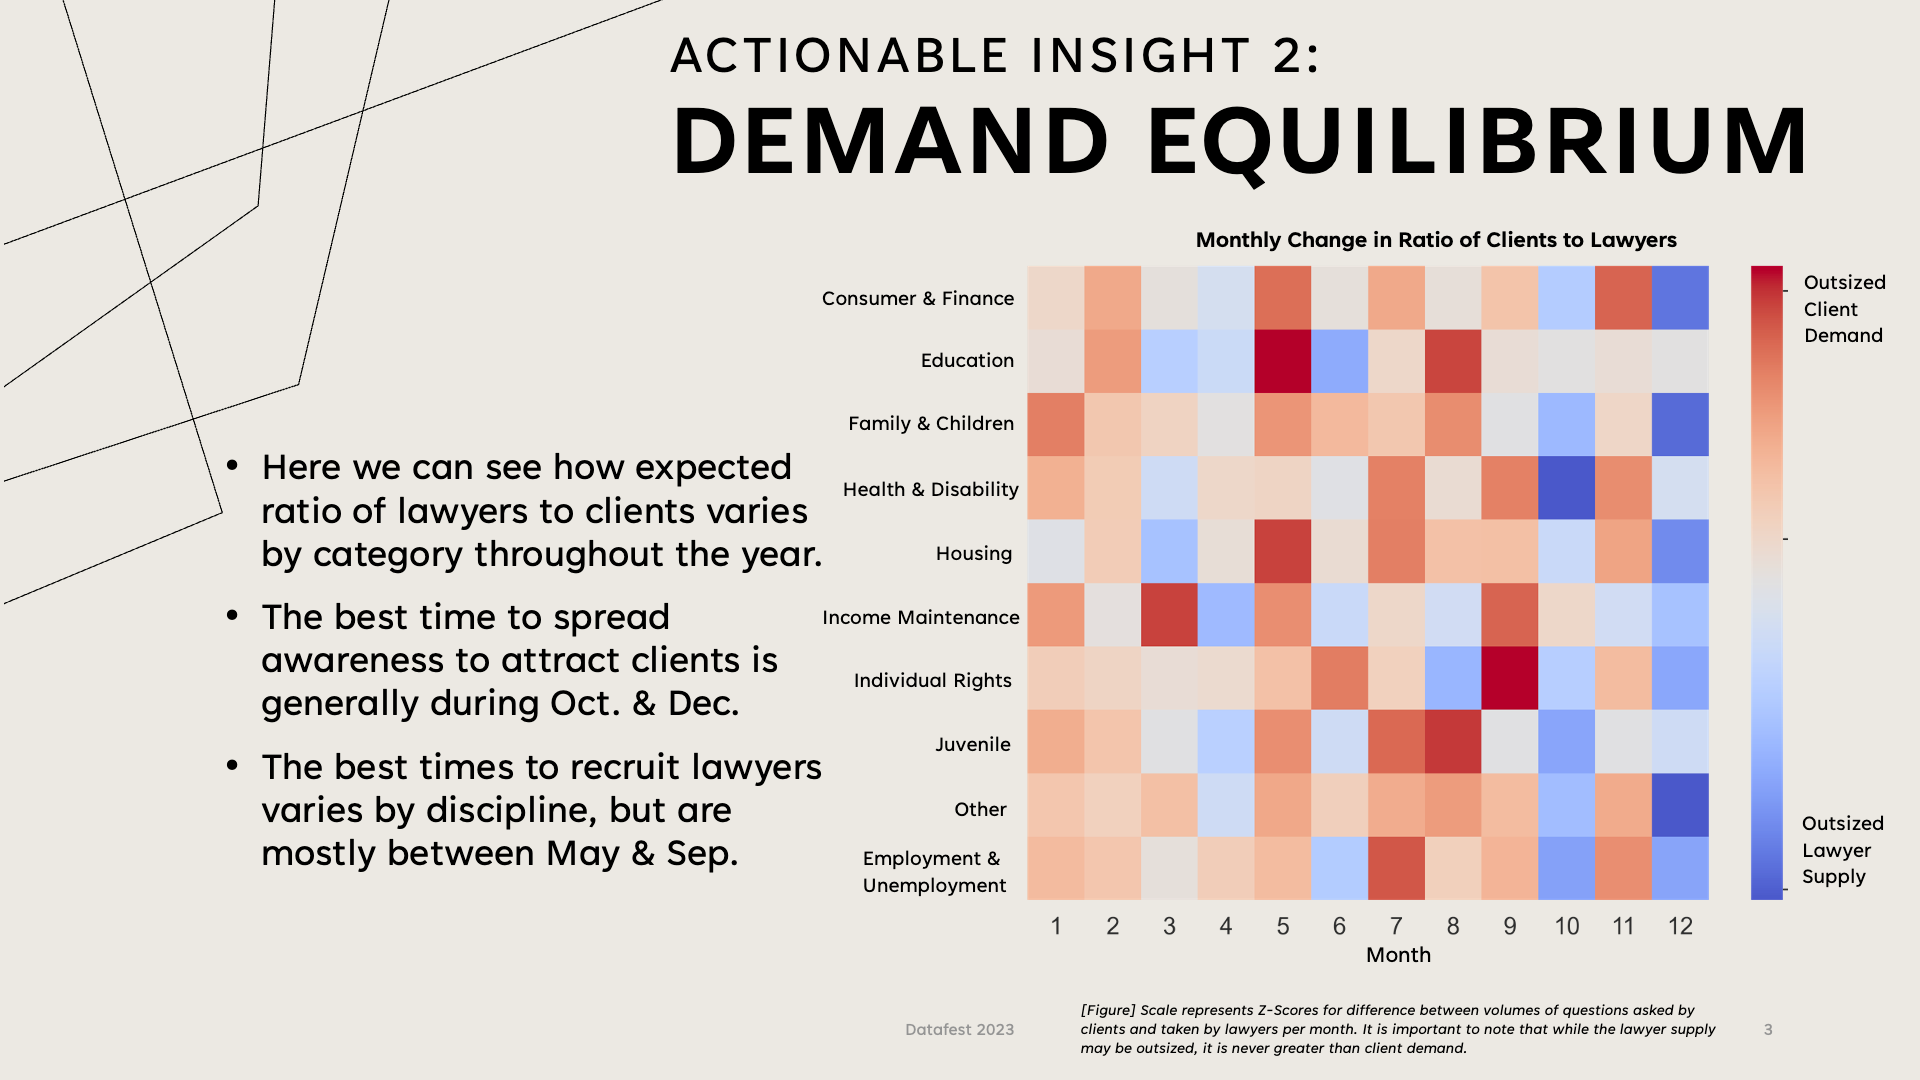
Supply and Demand Equilibrium
In this section, we looked at the supply and demand of legal advice. We came to the assumption that the ratio of ‘questions asked to answers given’ is a good indicator of the supply and demand of legal advice. We found that the ratio is not fixed, and varies quite a lot through the year, and differently across categories. For example, we can see the two most in demand periods for legal advice pertaining to income maintenance fall in March and September, each month coinciding with tax filing deadline and the extended tax filing deadline, which makes sense.
From this chart, we can infer the best times to recruit new volunteers to answer questions, and the best times to recruit more users to ask questions. For example, lawyers seem to be much more available to volunteer during October and December in general, which implies these might generally be the best times to recruit new volunteers to the program.
My Role
I designed the graphics titled ‘Gender’, ‘Categories’, and ‘Demand Equilibrium’ (conceptualizing and creating the latter being the majority of my time and effort). I also designed and put together the slides and video for presentation, as well as the final editing/revisions of all submitted work.